

Its that time of the month again when we get to see how our good friends over at google are doing with all them different versions of Android. Since March there have been some decent percentage movements with Android and its dominance from version to version. KitKat as expected has started to make a bit more headway to more devices moving from 2.5% to 5.3%, a rather good increase in only a month. Its worth noting too that this is all android devices which log into the Google Play Store and with version 2.2 and newer.
Heres a rundown of where everything else is… Jellybean at 61.4%, Ice Cream Sandwich at 14.3%, Honeycomb at 0.1%, Gingerbread at 17.8% and Froyo at 1.1%. Some very different numbers there.
In comparison to March heres a breakdown of the movements… KitKat up 2.8%, Jelly Bean declined 0.6%, Ice Cream Sandwich declined 0.9%, Honeycomb remained at 0.1%, Gingerbread declined 1.2%, and Froyo declined 0.1%. So all in all there all moving in the right direction, if not a little slow for everyones liking. I don’t think android will have us all on the latest version together for some time… if ever..
I think we will see some sharp increases over the next month or two with the launches of new Flagship Devices on 4.4 KitKat so expect the next set of results to look quite different. Just so you can do some comparisons heres data from March 2014 and April 2013.
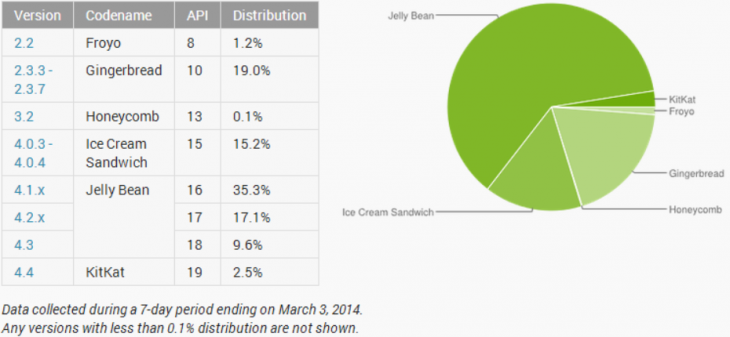
March 2014
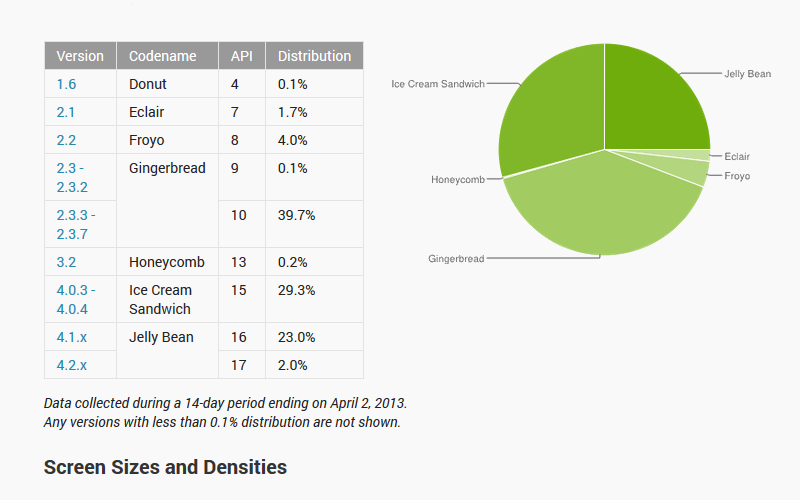
April 2013
If you fancy checking out a little more data including Screen Sizes & Densities as well as Open GL Version Data then click on the source link below:
Source – Google Dashboard